First Access
Once OIBus is running, open a browser and navigate to http://localhost:2223.
The default login is admin with password pass.
Change the password immediately after your first login in the User Settings section.
The default port 2223 can be changed in Engine Settings if it conflicts with another service.
Home Page
The home page gives a real-time overview of your OIBus instance: enabled South and North connectors are listed with their live metrics, and the engine status is shown at the top.
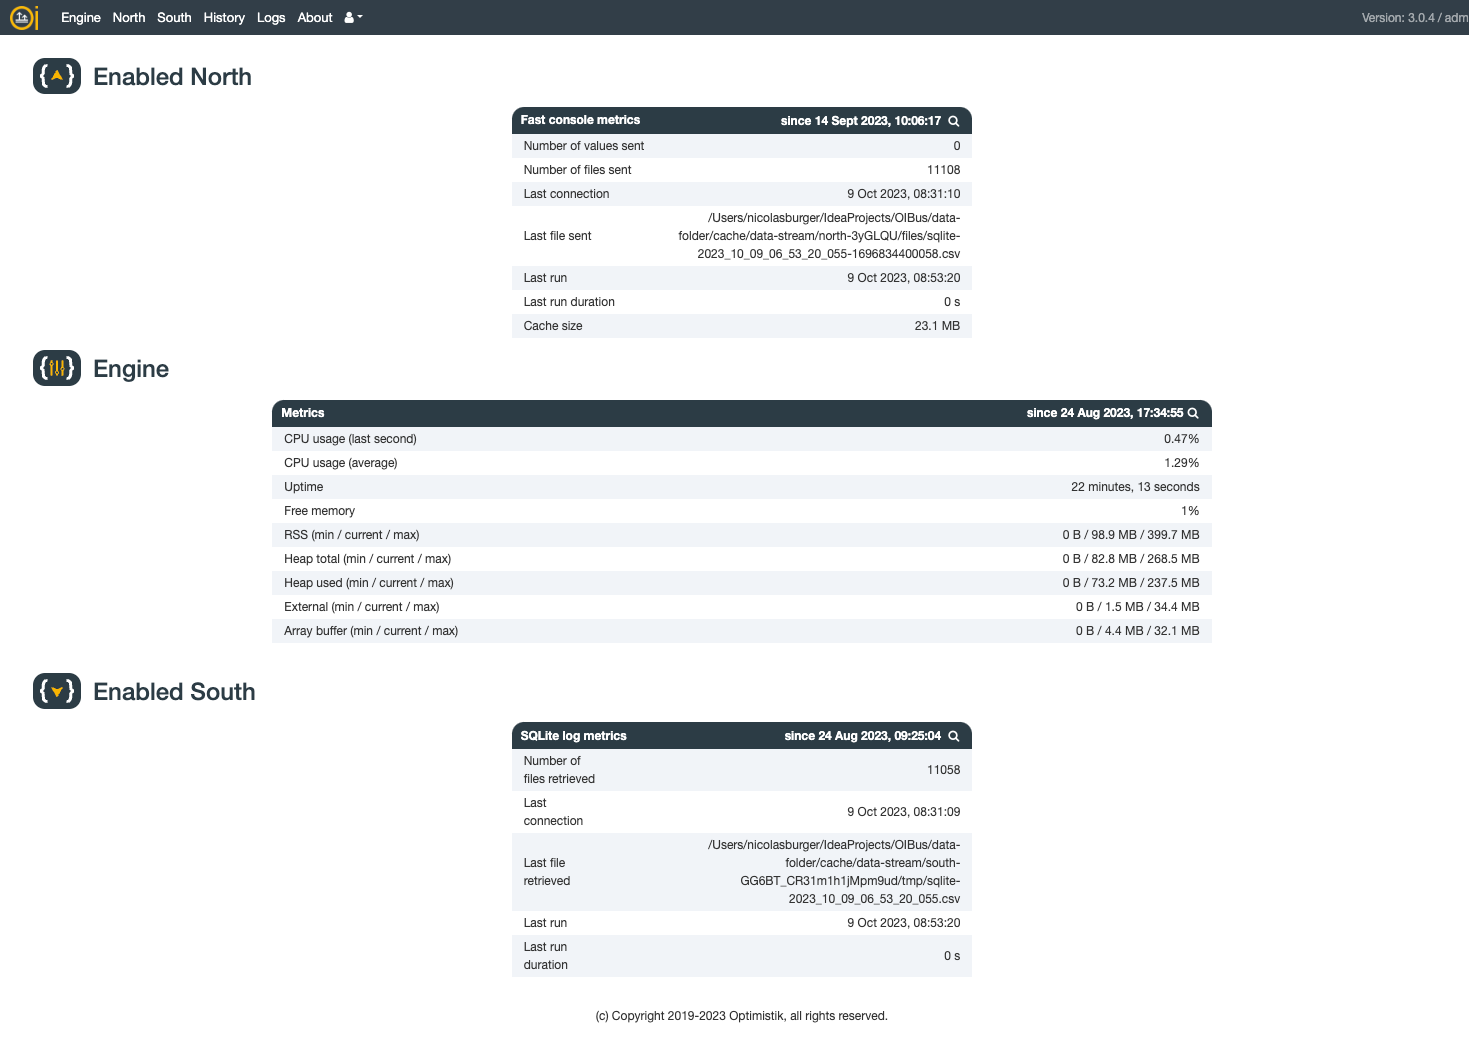
Click the magnifying glass icon next to any connector or the engine to open its display page, where you can inspect detailed metrics and cache status.
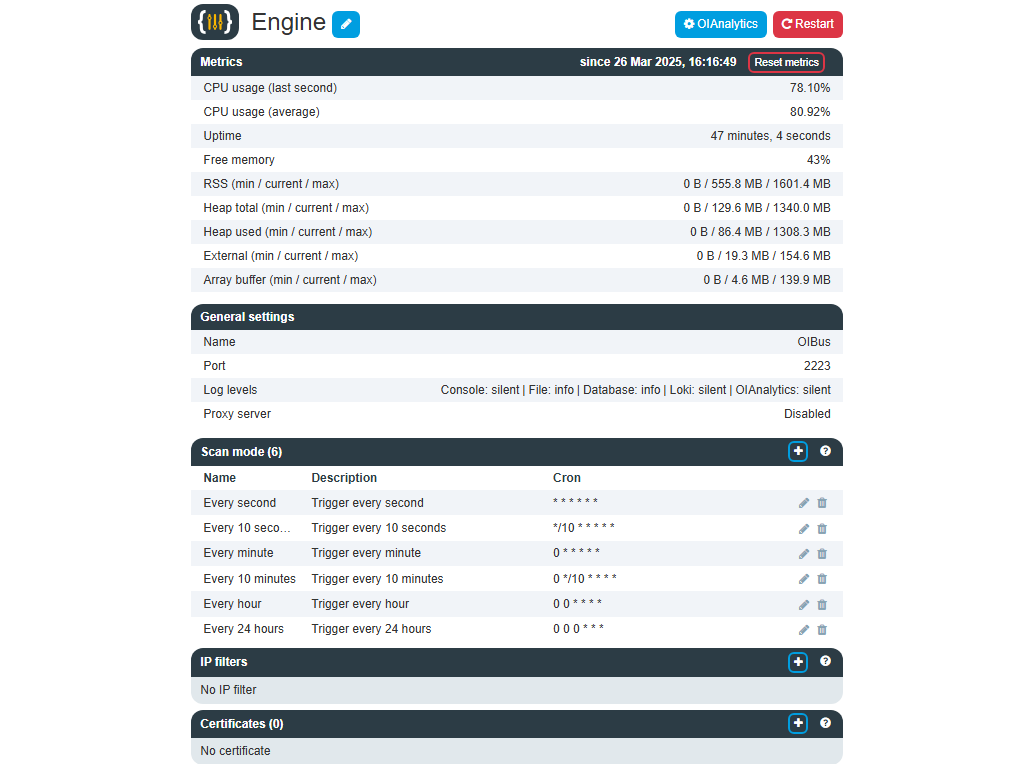
Engine
The engine page is the control centre for OIBus-wide settings. From here you can configure:
- Engine settings (name, port, proxy server)
- Logging parameters
- Scan Modes
- IP Filters
The Restart button works only when OIBus is running as a system service. It signals the service manager to stop and restart the process — the service itself handles the actual restart.
If OIBus is started manually (e.g. from a terminal), the restart button will stop the process without bringing it back up automatically.
To access OIBus from another machine, add an IP filter — including via curl for automated setups. See IP Filters for details.
Engine Metrics
The engine display page shows real-time resource usage for the OIBus process:
| Metric | Description |
|---|---|
| CPU usage | Instantaneous CPU usage and rolling average over recent intervals. |
| Uptime | Time elapsed since the OIBus process last started. |
| Free memory | Percentage of system memory currently available. |
| RAM usage | Process memory resident in RAM — minimum, current, and maximum since startup. |
| Heap total | Total memory allocated for the JavaScript heap. |
| Heap used | Memory actively used within the heap. |
| External memory | Memory used by native extensions (e.g., C++ bindings). |
| Array buffer | Memory allocated for binary data buffers. |
North Connectors
North connectors define where OIBus sends data. Click + to add a new connector and choose from the available types.
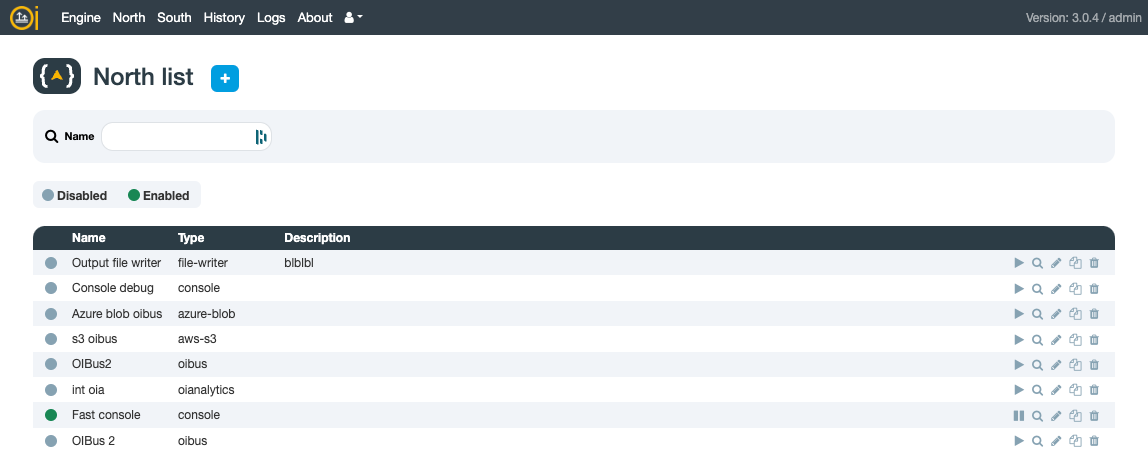
Each connector in the list has the following actions on the right-hand side:
- Enable / Disable — toggle the connector on or off without deleting it
- Display — open the connector's monitoring page (metrics, cache status, recent transmissions)
- Edit — modify the connector's settings
- Duplicate — create a copy of the connector with a new name
- Delete — permanently remove the connector
Refer to the North connectors guide for details on cache settings, throttling, and transformers.
South Connectors
South connectors define the data sources OIBus reads from. Click + to add a new connector and choose from the available protocols.
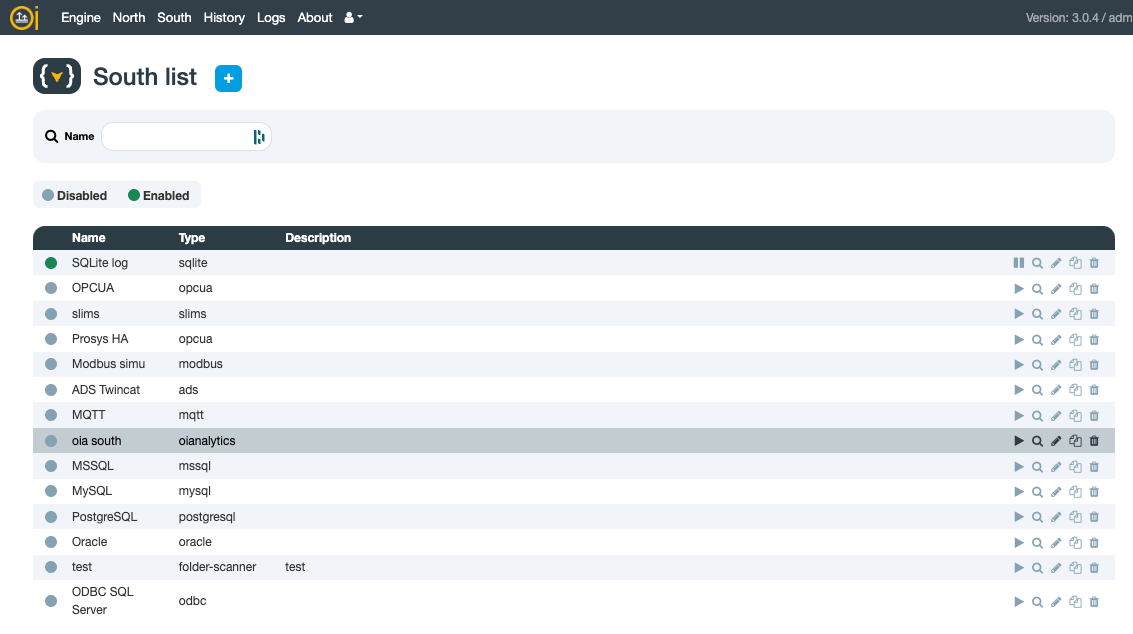
Each connector in the list has the following actions on the right-hand side:
- Enable / Disable — toggle the connector on or off without deleting it
- Display — open the connector's monitoring page (metrics, last scan times, subscription status)
- Edit — modify the connector's settings
- Duplicate — create a copy of the connector with a new name
- Delete — permanently remove the connector
Refer to the South connectors guide for details on scan modes, items, and subscription-based protocols.
History Queries
History queries replay a time range of data through a South connector and forward it to a North connector. Click + to create a new history query.
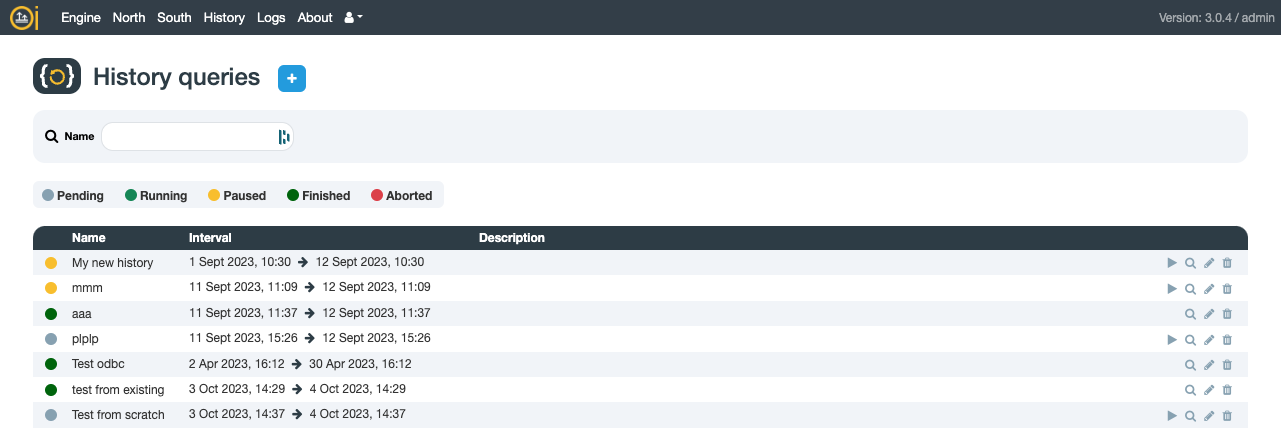
Each history query in the list has the following actions on the right-hand side:
- Start / Pause — begin or suspend the query execution
- Display — open the query's monitoring page (progress, metrics)
- Edit — modify the query's settings
- Duplicate — create a copy of the query
- Delete — permanently remove the query
Refer to the History Queries guide for details on time range configuration and execution controls.
Logs
The log page displays OIBus runtime logs and refreshes automatically every 10 seconds.
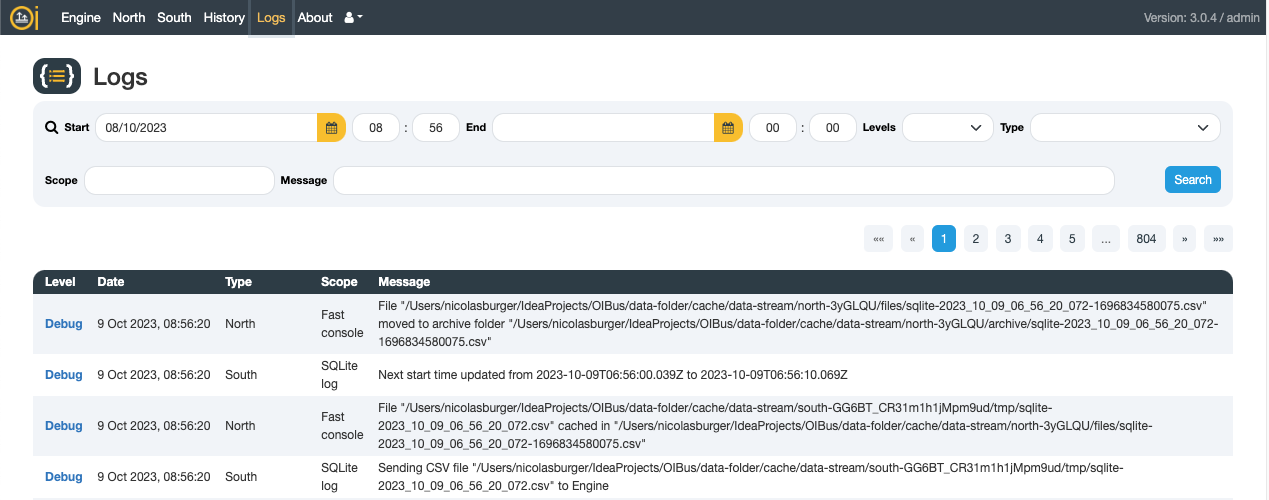
Use the filters to narrow down what you see:
| Filter | Description |
|---|---|
| Date range | Show only logs within a specific time window. |
| Level | Filter by severity: trace, debug, info, warn, error. |
| Scope | Restrict logs to the engine, a South connector, a North connector, or a history query. |
| Message | Search by free text within log message content. |
Log verbosity is configured per destination (console, file, database, OIAnalytics) in Engine Settings → Logging Parameters.
About
The About page shows version and build information for the running OIBus instance, along with a link to this documentation.
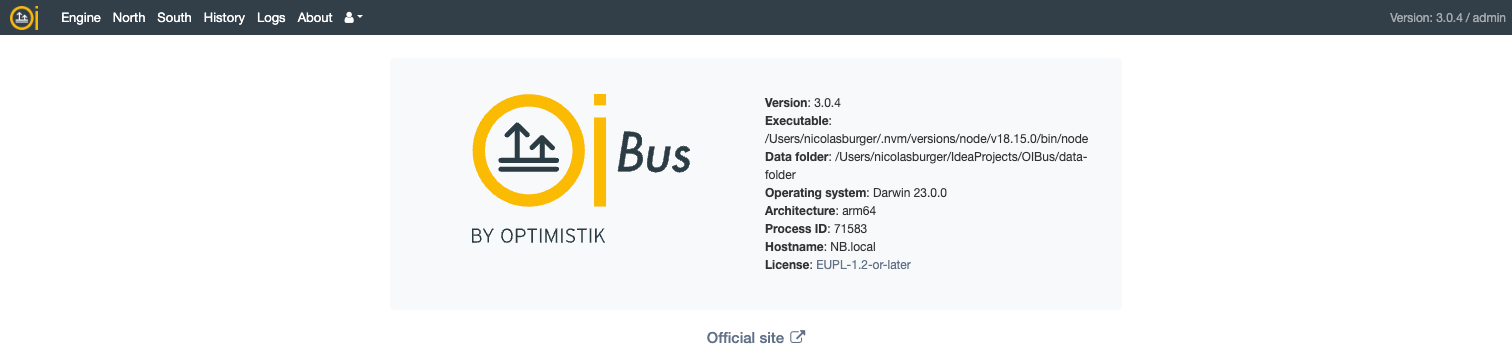
Use this page to confirm the exact version when reporting issues or checking compatibility with OIAnalytics.
User Settings
The User Settings page lets you update your account password and set the timezone used for date and time displays throughout the interface.
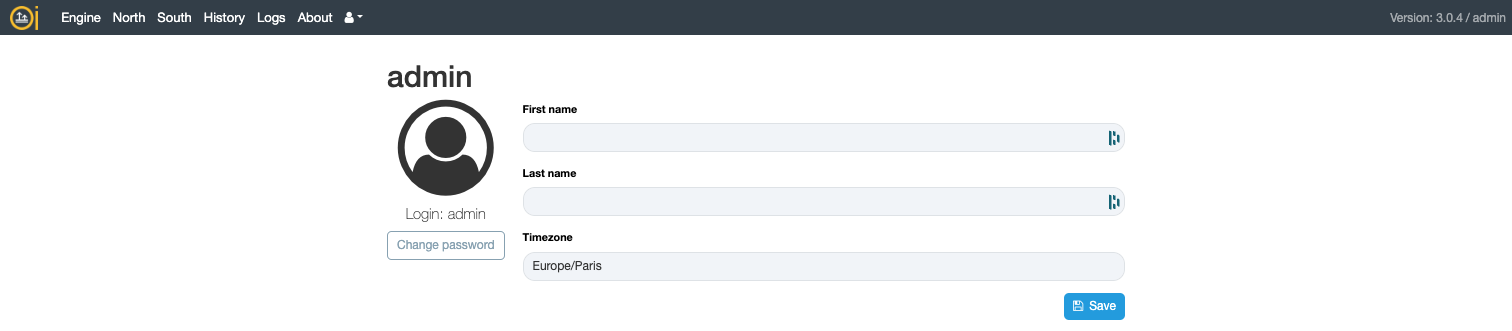
| Setting | Description |
|---|---|
| Password | Change the current user's login password. |
| Timezone | Select the timezone for all date/time values shown in the interface. |